Improving Rolling Mill Productivity
using AI & Data Analytics
Submitted by
Abhyudaya B Tharakan
22f3001492
Business Data Management Capstone Project
Indian Institute of Technology, Madras
Contents
2. Detailed Explanation of Analysis Process/Method 2
Data of production of channel-75 2
Comparative Statement of Cost of Production 3
Operational Efficiency and Issue Analysis of Channel 75 Production 9
4. Interpretation of Results and Recommendation 18
Channel 75 Hourwise Data Interpretations 19
Digital Transformation for Record-Management 20
Advanced Analytics and AI Integration 20
Process Optimization and Downtime Reduction 21
Reporting, Monitoring, and Continuous Improvement 21
Title:Improving Rolling Mill Productivity using AI & Data Analytics
This report outlines our approach to address operational challenges at Bhilai Steel Plant's Merchant Mill, specifically the failure of the stand-4 component and the inefficiencies of Channel 75. We have significantly improved the productivity and efficiency of the merchant mill under the guidance of Shri SK Hariramani, General Manager and HOD, Merchant Mill.
When investigating the unanticipated eight-hour downtime of stand-4, it was discovered that it was primarily attributable to operational demands that exceeded the component's tolerance. This led to the development of methods to predict problems and prevent them from occurring again.
Our investigation into Channel 75 production shed light on the factors behind its low fulfilment rate of 35.43%. Digitized operational logs and analysis data helped us identify and rectify specific operational and mechanical issues, underscoring the need for ongoing monitoring and parameter adjustments.
AI and data analytics have been key to improving mill efficiency, giving a more profound understanding of plant dynamics and driving improvements in machinery reliability and output.
In summary, our targeted strategies have significantly enhanced the Merchant Mill's operational performance. This initiative addresses immediate challenges and provides a roadmap for sustained innovation and efficiency at Bhilai Steel Plant, demonstrating the efficacy of sophisticated analytics and technology in industrial operations.
The Merchant mill at Bhilai Steel Plant is documented across logbooks and sheets segmented by Electrical, Mechanical, and Operations categories, as previously noted in the mid-report. A two-fold approach was proposed to address this issue: utilizing Boyce-Codd Normal Form (BCNF) for data normalization and employing AI-driven multimodal Large Language Models (LLMs) to transform handwriting into a structured format suitable for analysis. It's important to acknowledge that handwriting transcription remains at the forefront of research, presenting unique challenges. To bridge the gap between technology and practical limitations, manual review was implemented to ensure accuracy and reliability of the transcription process. Weeks of time that would have been used for transcription manually were saved by this.
Before we proceed with the justification, it's essential to comprehend the dataset at our disposal:
Channel-75 Hourwise Data: This dataset about 504 rows encapsulates logs from Channel 75, meticulously recorded over 79 shifts which was selected based on the review of the last 24 months or 2,232 shifts, as detailed in the midterm report. This data is currently documented through traditional bookkeeping, which doesn't conform to a structured data format suitable for analysis. It primarily consists of descriptive remarks, which were converted to BCNF format. Key components of the transformed dataset include:
Additionally, I have also collected the Financial data. The data has been sourced from the Accounts Department of the Merchant Mill, serving as metadata or an additional layer to the production data. This financial dataset enriches the operational data with crucial insights into cost management, profitability, and economic efficiency, bridging the gap between raw production metrics and financial outcomes. By integrating this financial perspective with the core production data, we gain a comprehensive view of the operational efficiency, cost structures, and profitability margins of the Merchant Mill. This integrated approach allows for a more informed analysis and decision-making process, aligning operational strategies with financial performance objectives.
In addition to the operational logs, we have compiled data on the operational parameters critical for managing the mill process. Historically, these parameters were set based on the original engineering design schematics. However, this methodology did not account for the gradual wear and tear affecting the equipment's current condition, presenting a significant limitation in optimizing operational efficiency.
To address this challenge, we introduced and implemented a revised strategy. This approach involves analyzing the operational parameters from the previous shift, specifically focusing on those associated with higher production outputs. By incorporating this real-time data, we adjust the mill's operational settings accordingly. The determination of optimal parameters is guided by examining both the cobble count and production volume, aiming to identify the conditions that yield the most favorable outcomes.
Therefore, our analysis focuses exclusively on the shift data from September 2023, chosen for its timeliness and because it marks the period of highest production observed across both 2022 and 2023.
On January 11th, following the notification of a part failure that occurred on the 9th and 10th, I was referred to the PLC data from the 1995 computer system, which includes live trend graphs as detailed in the midterm report. This step was taken to investigate potential precursors to the part failure and to determine if such failures could be anticipated solely through trend graph analysis. Due to the data being stored in an outdated proprietary format, it was manually transcribed, covering intervals of 10 minutes from the 8th to the 10th, resulting in approximately 300 rows of data. The dataset focuses on the current load, which represents the electric current drawn during the metal compression process by the motor. Within this context, the most noteworthy observation is the “kick off load,” marked by the highest peak in the data, indicating a significant event when the billet has entered.
To comprehensively understand the operational challenges and component failures, a multi-faceted analytical approach will be employed. This framework includes:
The outcomes and insights from this report are already being implemented, with visible effects as discussed in my interview with the Head of Department of Merchant Mill, General Manager Shri SK Hariramani. These have significantly enhanced the productivity and efficiency of the mill. I recommend thoroughly reviewing the entire interview to fully understand its impact before proceeding further.
First, We aim to analyze the specific factors that led to the failure of part stand-4. Typically, such failures result in operational downtime ranging from 45 minutes to 2 hours; however, in this instance, the failure caused an unprecedented 8 hours of downtime. By identifying and examining the precursors to this failure, we can gain insights into the warning signs indicative of potential part malfunctions. This understanding will enable us to predict when a part might fail and implement preventative measures to avoid similar issues in the future.
The analysis was done using python and pandas, seaborn and can be found here.
The data obtained from the PLC system can be found here.
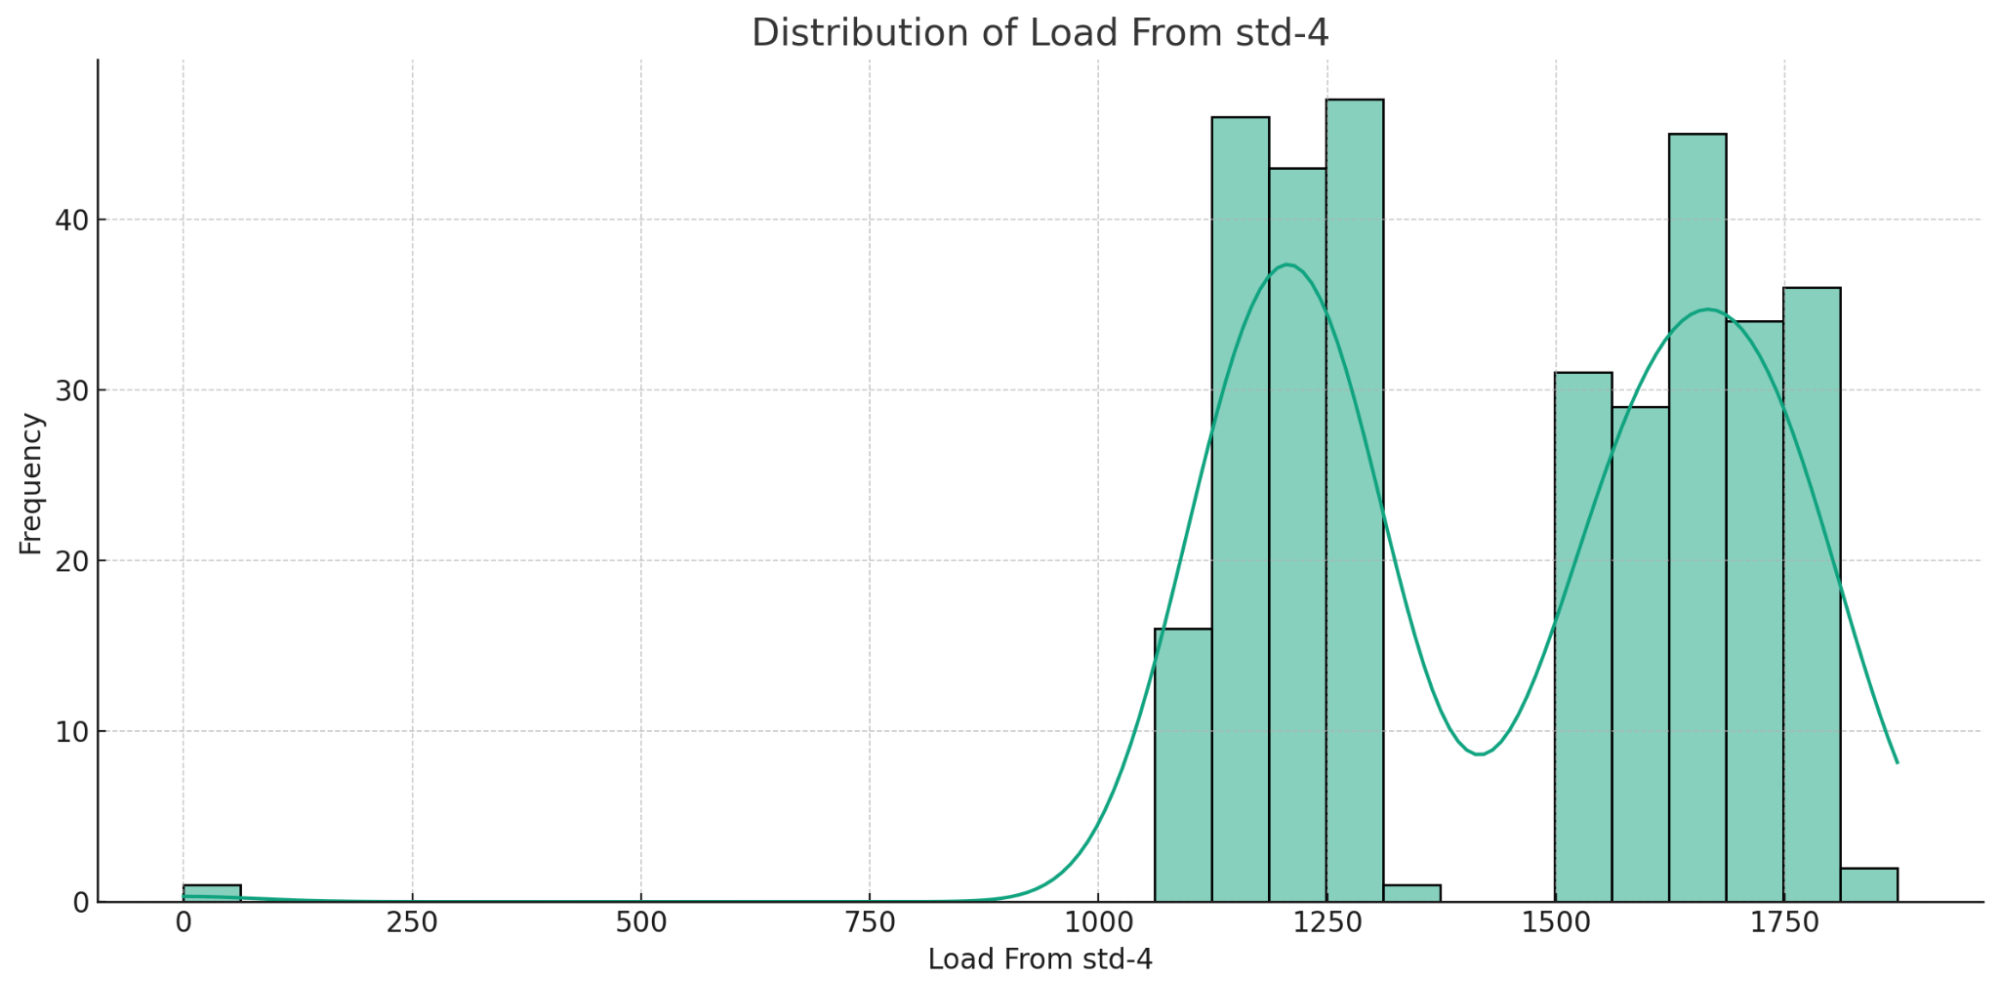
To gain a more in-depth insight into the data, it's crucial to analyze its distribution and categorize its types. This approach not only aids in understanding fundamental statistical measures, such as the average and standard deviation, but also aligns with the analytical system employed by the mill.
From the analysis of the data extracted from the PLC system, which primarily focuses on instances during notable breakdown periods, it's evident that a significant portion of the data relates to breakdown events. This insight, combined with input from the operating staff, leads to the conclusion that the optimal operational load range for the system should be between 1100 and 1300. Establishing this range is crucial for setting the correct mill settings.
The data exhibits a bimodal distribution, indicating that the part operated under two distinct conditions during the observed period. Furthermore, the presence of a bell-shaped distribution within the 1500 to 1900 range highlights data points that can be considered outliers. The spread of this distribution suggests high variability in the operational conditions, implying that the parts may experience fluctuating stresses. Such variability is a potential factor contributing to the failures observed, underscoring the need for careful monitoring and adjustment of operational parameters to mitigate the risk of future breakdowns.
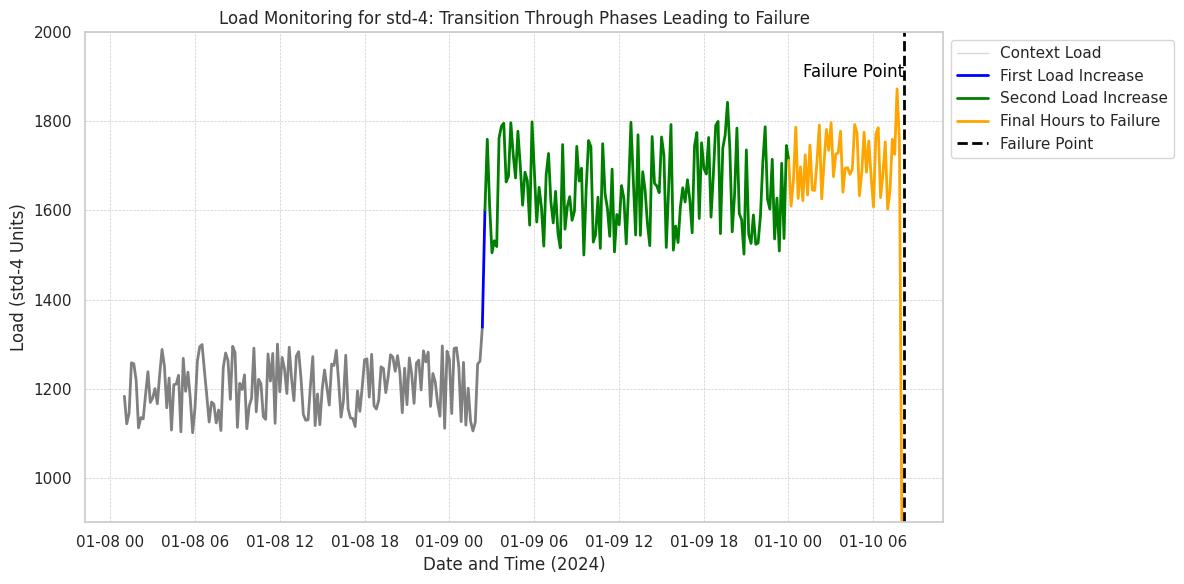
In the midterm report, we categorized the operational timeline into distinct phases, as follows:
Period Description | Start Time | End Time | Load Range | Maximum Load |
Normal Operation | Before Jan. 9, 2:20 AM | Jan 9, 2:20 AM | 1100-1300 | - |
First Load Increase | Jan 9, 2:20 AM | Jan 9, 2:31 AM | 1200-1400 | - |
Second Load Increase | Jan 9, 2:31 AM | Jan 10, 12:01 AM | 1500-1800 | 1843 |
Final Hours to Failure | Jan 10, 12:01 AM | Jan 10, 8:10 AM | 1600-1800 | 1873 |
Complete Failure | Jan 10, 8:12 AM | - | 0 | 0 |
We can further look at this graphically to Understand the Phases better:-
This breakdown suggests a progressive failure mode rather than an abrupt malfunction, indicating a possible systematic oversight in operational monitoring. The data analysis illustrates the need for diverse temporal perspectives when examining PLC data. By observing data at intervals of 10 minutes, hourly, and daily, rather than just minute-wise in the current analytical system, there is potential for earlier detection of abnormal patterns, possibly preventing the failure.
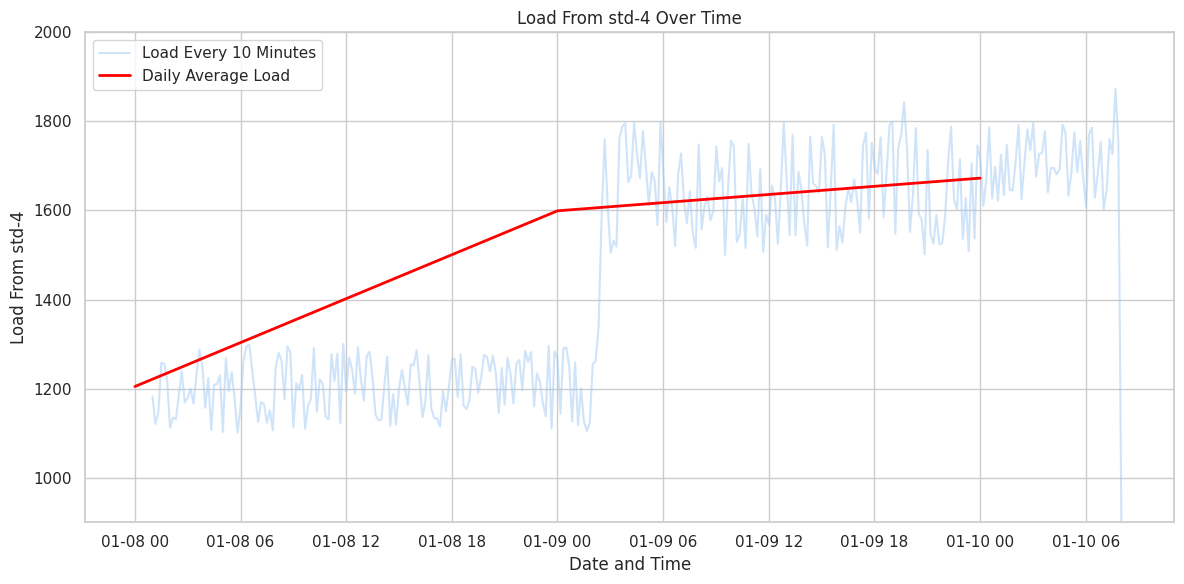
We can try to look at the load from stand-4 measured every 10 minutes alongside the daily average load, which helps in understanding the overall trend and providing an analytical baseline for comparison.
The daily average line serves as an analytical baseline, indicating a rising trend in the load over time, which may have contributed to the part’s failure. Notably, the daily average smoothes out the short-term fluctuations, highlighting the underlying increase in load that may not be immediately apparent when observing only high-frequency data. This is a significant insight since, now, we can establish that the final hours to failure can also be considered the “fatigue limit”. This also further establishes our assumption about progressive failure, which might have occurred over days leading up to breakdown.
The rising trend in the daily average load might have served as a warning signal for predictive maintenance. Had this trend been monitored, maintenance could potentially have been scheduled before reaching the fatigue limit. The graph can also be used to investigate operational cycles, which might affect the load and consequently the wear and stress on stand-4.
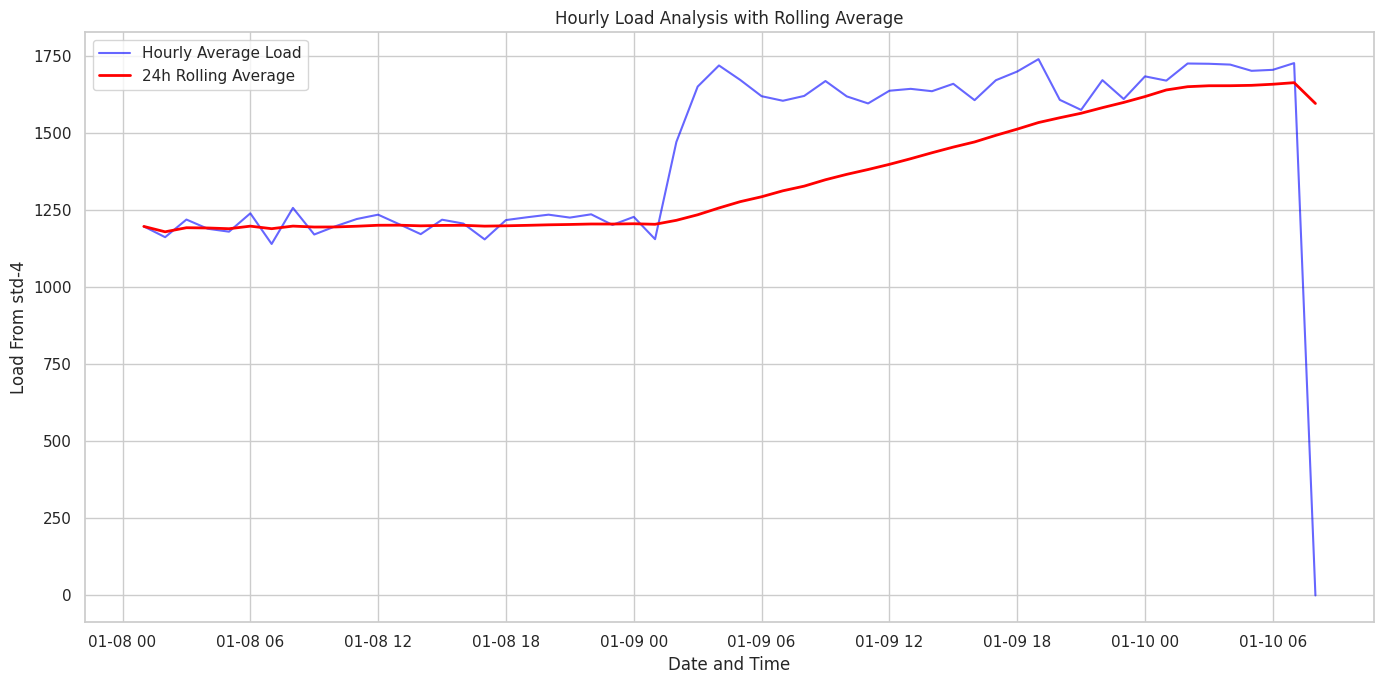
We can further look at the hour average load with a 24-hour rolling average, which should confirm this trend as well as smoothen out the volatility of the data.
We can also observe that before the sharp fall to zero which indicates that the part has failed, the rolling average shows a pronounced uptick, which aligns with the 'Final Hours to Failure' phase described earlier. Indicating that the stand-4 endured load near the fatigue limit more frequently in the 24 hours before failure.
Unlike the previous graph, which suggested an overall rise in load, this graph highlights how the part was handling loads closer to its upper operational threshold more consistently in the final day. This might not be as evident in a simple daily average.
The critical warning point where the rolling average begins to rise more steeply could be identified as an inflection point for intervention, which, if heeded, may have prevented the eventual breakdown.
Through systematic analysis, we discern that stand-4's load pattern altered significantly preceding its failure. Initially maintaining a bimodal operational state, the system began registering escalating load values, stretching from the typical 1100-1300 range to an elevated 1200-1400, and eventually peaking between 1500-1800 and 1600-1800. These values, particularly the spikes to 1843 and 1873, signal abnormal stress likely contributing to the part's eventual failure. The sudden cessation of load readings post-8:12 AM on February 10th suggests a complete functional breakdown.
We now shift our focus to a broader operational context. The subsequent analysis delves into the Channel 75 production data, aiming to dissect the operational efficiency, issue prevalence, and production outcomes over recent years.
Through an in-depth investigation of production volumes, issue frequency, and temporal operational patterns, we aim to uncover systemic vulnerabilities and opportunities for enhancing overall production resilience and efficiency.
This should also help us to understand the factors that resulted in a lower fulfillment rate of 35.43% out of the planned 42000 tons in the 2022-23 session.
The collected data for this can be found here, which pertains to sessions from the years 2022 and 2023.
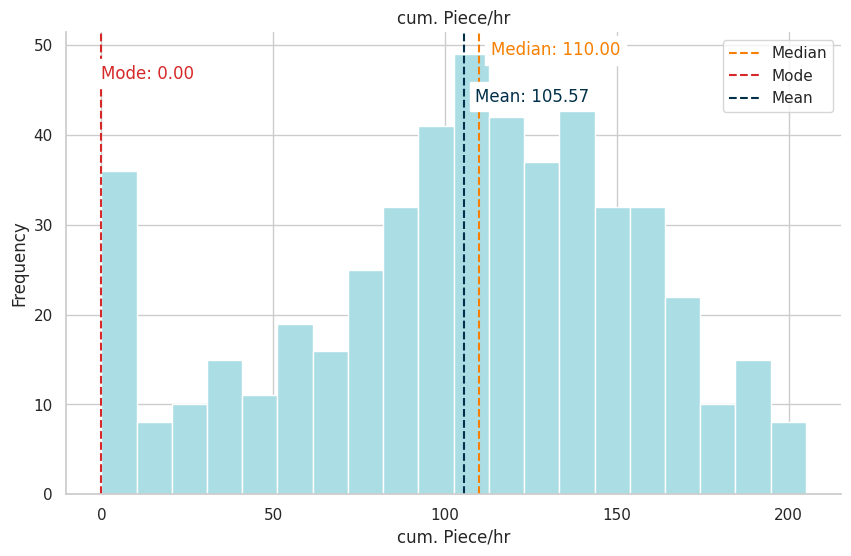
A contributing factor to the reduced fulfillment rate may be the low production levels of the CH-75.
Considering the current mean production value, we can estimate that a minimum span of 40 days under optimal conditions would be required to meet the target production volume. Yet, an examination of the data from 2022 and 2023 reveals that this level of sustained performance has not been achieved. The mode, falling to zero, suggests a significant amount of operational time may, in fact, be downtime, or time utilized for transitioning the supply line to Channel 75 from a different production profile. However, the midterm report highlighted a critical issue within the light structural division, which includes Channel 75: the presence of a negative margin. This raises concerns about potential inaccuracies in pricing or cost estimation on the sales front. It is imperative that this issue be thoroughly investigated and addressed before any escalation in production volumes.
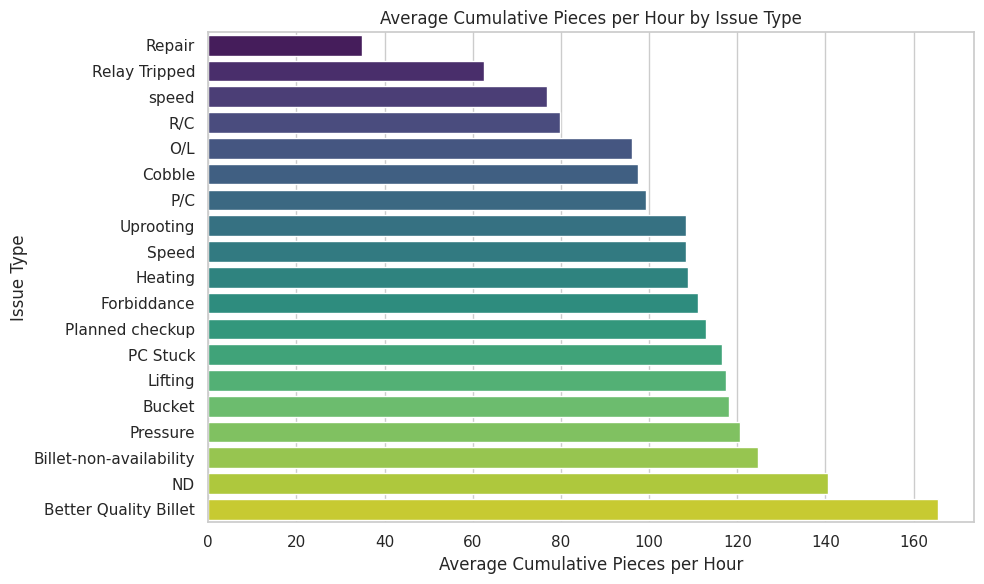
Further investigation is warranted into the issues that typically result in the greatest delays.
It is evident that changes in the product lineup—for instance, transitioning from TMT32 to Channel 75, commonly labeled as 'Repair,'—as well as occurrences of 'Relay Tripped,' exert considerable influence on production throughput. Simultaneously, the presence or absence of billets and their quality, while not directly diminishing production volumes, can substantially sway the quality of the manufactured goods. The higher frequency of ND billets compared to Better Quality billets might be a reason, for which we can see the lower production rate, hence should be ignored.
By setting the mean production rate of 106 pieces per hour as our operational benchmark, gleaned from the earlier histogram, it becomes clear that certain issues — namely 'Cobble,' 'P/C,' 'O/L,' and 'Uprooting' — lead to production figures that fall beneath this average. This underscores their substantial detraction from optimal production performance. Delving deeper, we observe that 'Speed' and 'R/C' issues, while closer to the threshold, still slightly undercut the mean, potentially signaling areas where marginal improvements could yield significant gains.
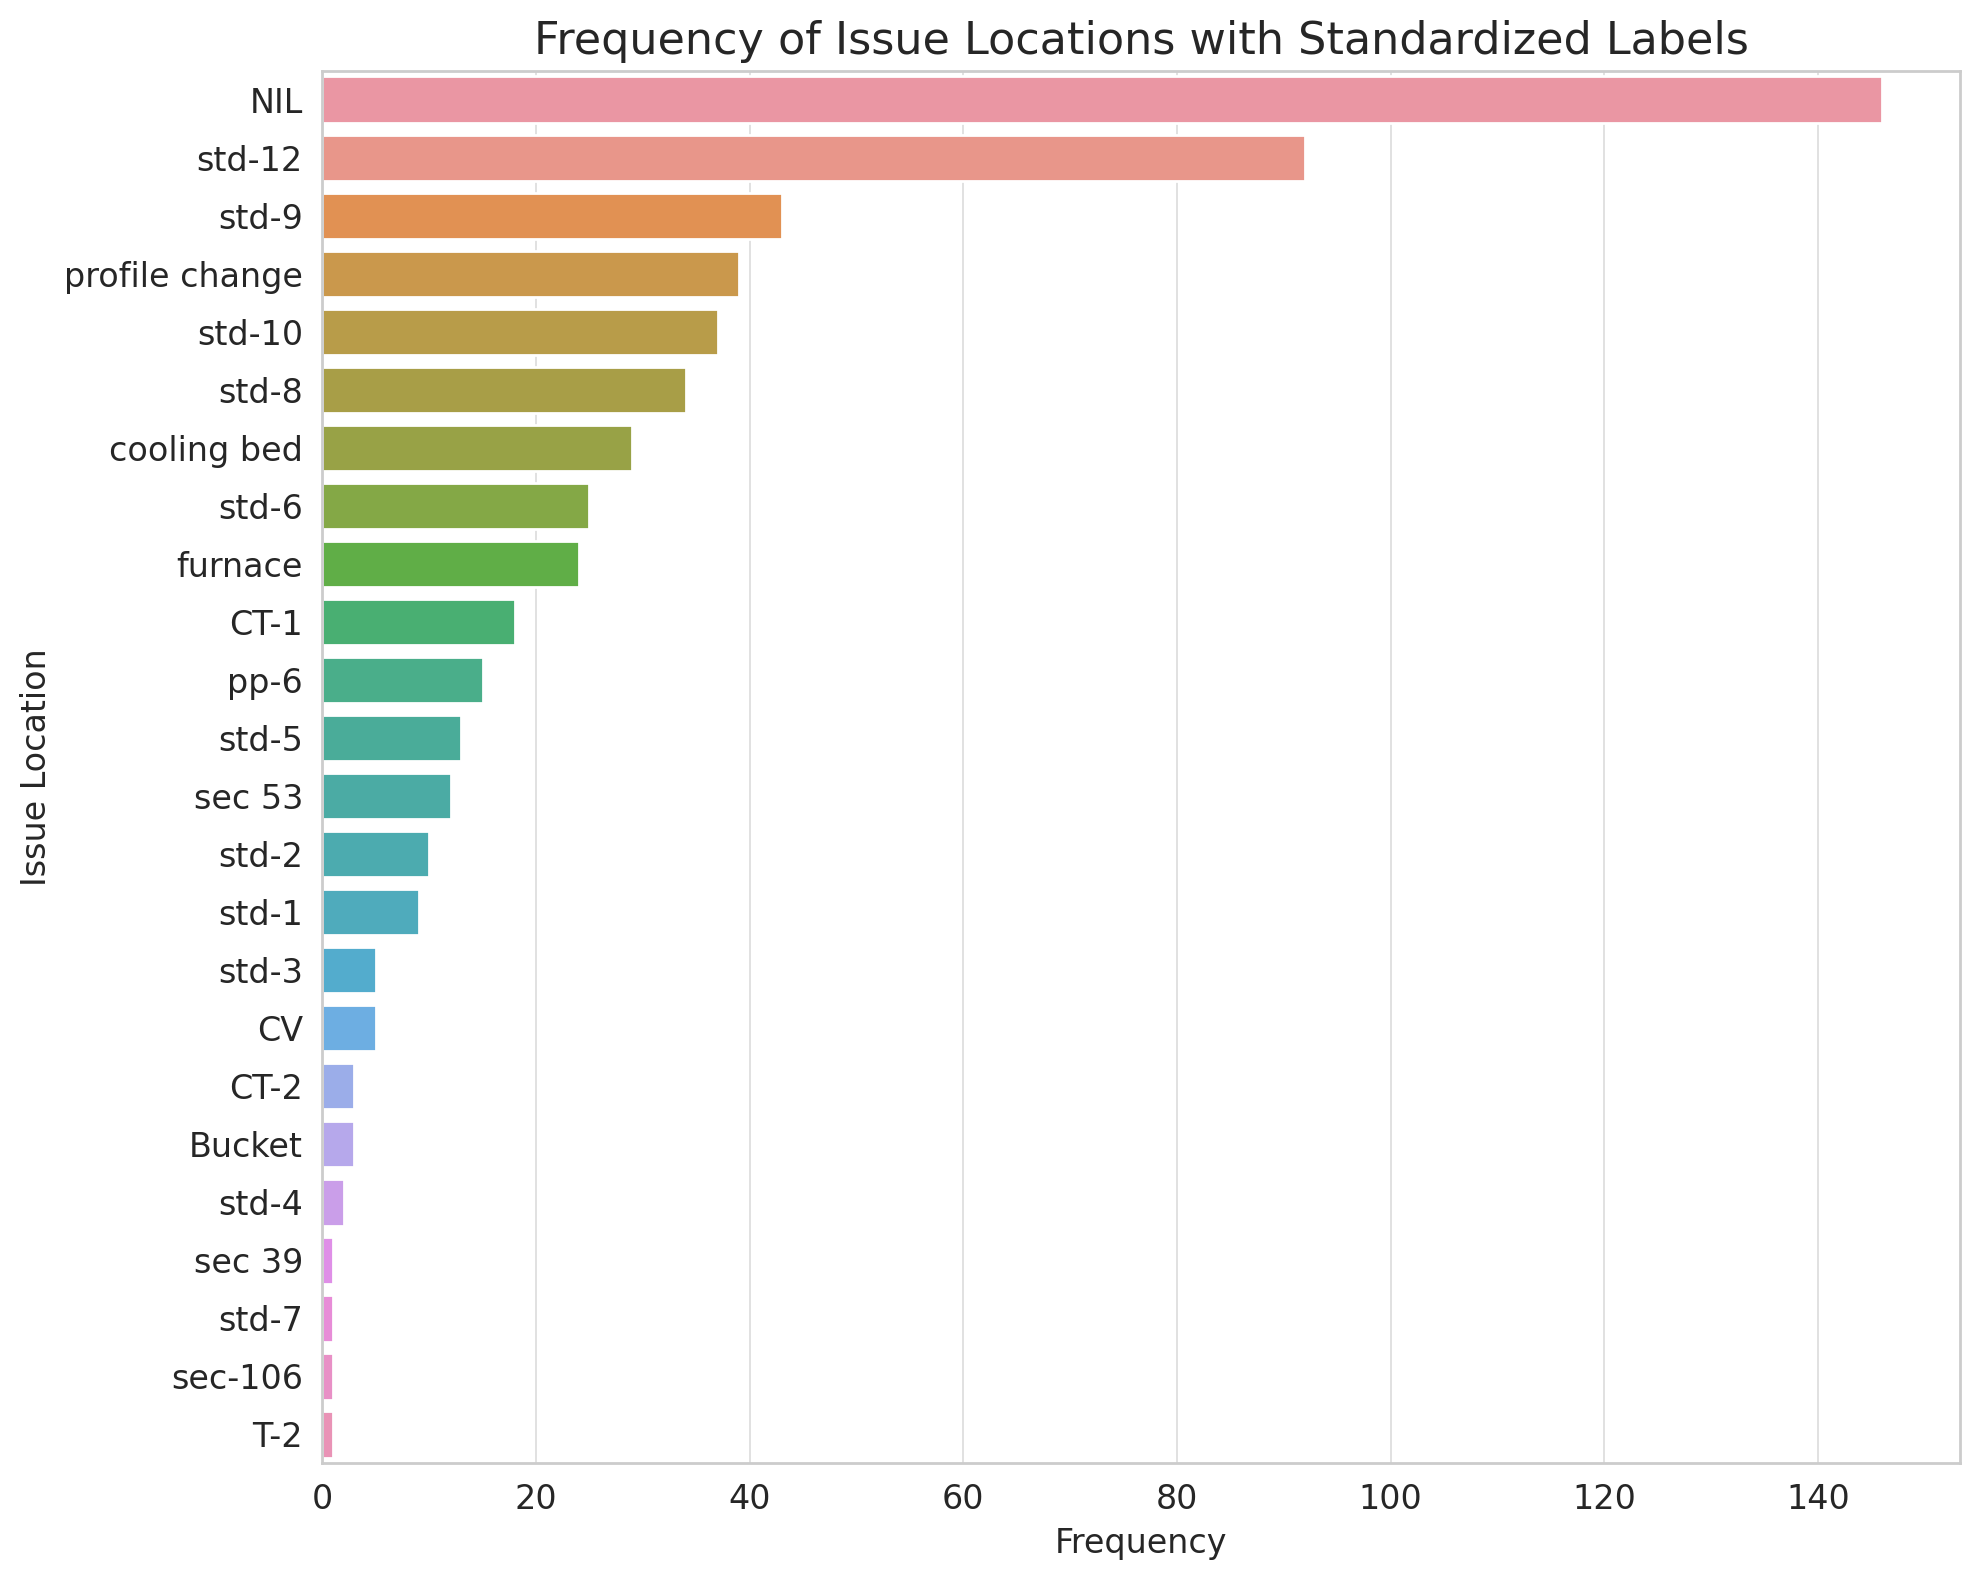
Nevertheless, a critical aspect to contemplate is the regularity and distribution of these events. The frequency of such disruptions can compound their impact, potentially leading to significant cumulative losses in production efficiency over time. Moreover, pinpointing the exact location of these issues within the production chain is pivotal. It can reveal operational bottlenecks and highlight areas where strategic interventions can optimize workflow and enhance overall production quality.
From the analysis, it becomes evident that specific locations, namely stand-8, stand-9, stand-10, stand-12, and the cooling bed, are frequent hotspots for operational issues within the mill. The expression “NIL” is primarily used to refer to instances where no issues were reported, resulting in no disruptions. But it could also mean that the location information is missing or not given. This follows our findings during the midterm report, that these locations seem to follow the volume Pareto principle.
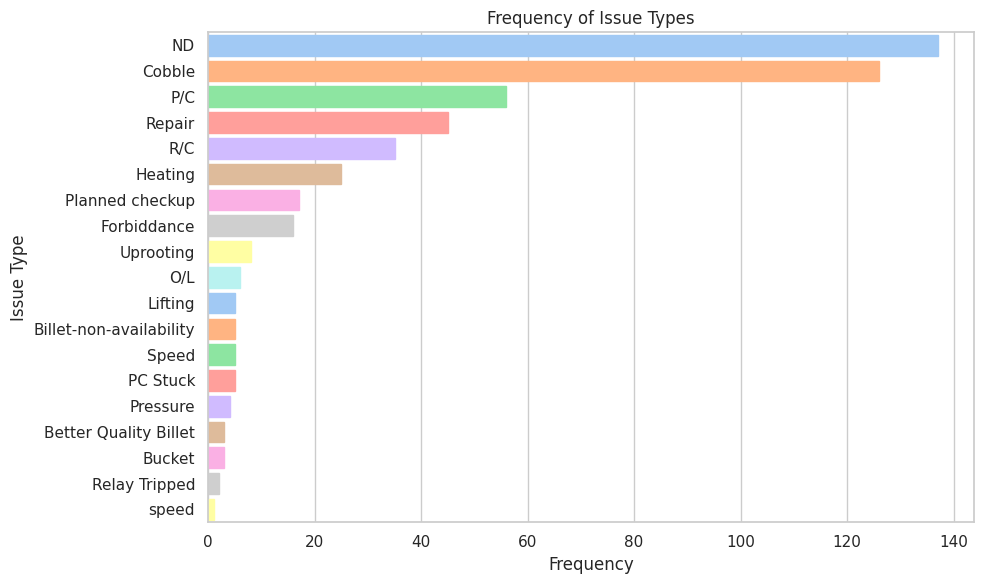
Upon closer examination, after removing instances categorized as “No Defect (ND)” from our dataset, we discern that a relatively small group of issue types predominantly drives the majority of production challenges encountered. Specifically, the issues identified as “Cobble”, “Profile Change (P/C),” “Repair,” and “Roll Change (R/C)” emerge as the most prevalent, accounting for a significant portion of the total issues reported. The breakdown of these contributions is as follows: “Cobble” issues represent roughly 25% of the total, “P/C” issues are about 11.12%, “Repair” issues approximate 9%, and “R/C” issues are close to 7%. Collectively, these four types of issues contribute to 71.39% of all recorded problems.
This pattern of distribution notably adheres to the Pareto Principle, which posits that a limited number of causes—approximately 20%—often lead to most of the effects, here approximated at 80%. While the exact figures don't match the Pareto Principle's typical 80/20 ratio, the essence of the principle is clearly reflected in our analysis. It demonstrates that a focused subset of issue types is responsible for the lion's share of production inefficiencies and challenges.
Delving deeper into the interplay between issue types and their specific locations affords us a more nuanced comprehension of the production challenges faced. This enhanced perspective enables us to discern whether the prevalence of certain issues is intrinsically linked to their locations within the production environment.
Cobble is identified as a significant issue, with locations such as stand-12, stand-6, stand-8, stand-9, Sec 53, the cooling bed, and CT-1 being notably prone to this problem.
Meanwhile, certain issues, like Forbiddance from PP-6 and heating issues from the furnace, are frequent and uniquely associated with specific locations.
Additionally, P/C, indicating phase changes, and R/C, denoting roll changes, are observed to frequently occur at locations such as stand-12, stand-10, and stand-9, highlighting these areas as focal points for these particular challenges.
The frequent occurrences of issues at stand-9, stand-10, and stand-12, as observed in graphs 7 and 9, along with the commonality of phase changes (P/C) and roll changes (R/C), suggest these stands are more susceptible to breakdowns compared to others. This pattern indicates a need for further investigation to identify the underlying causes of these disruptions.
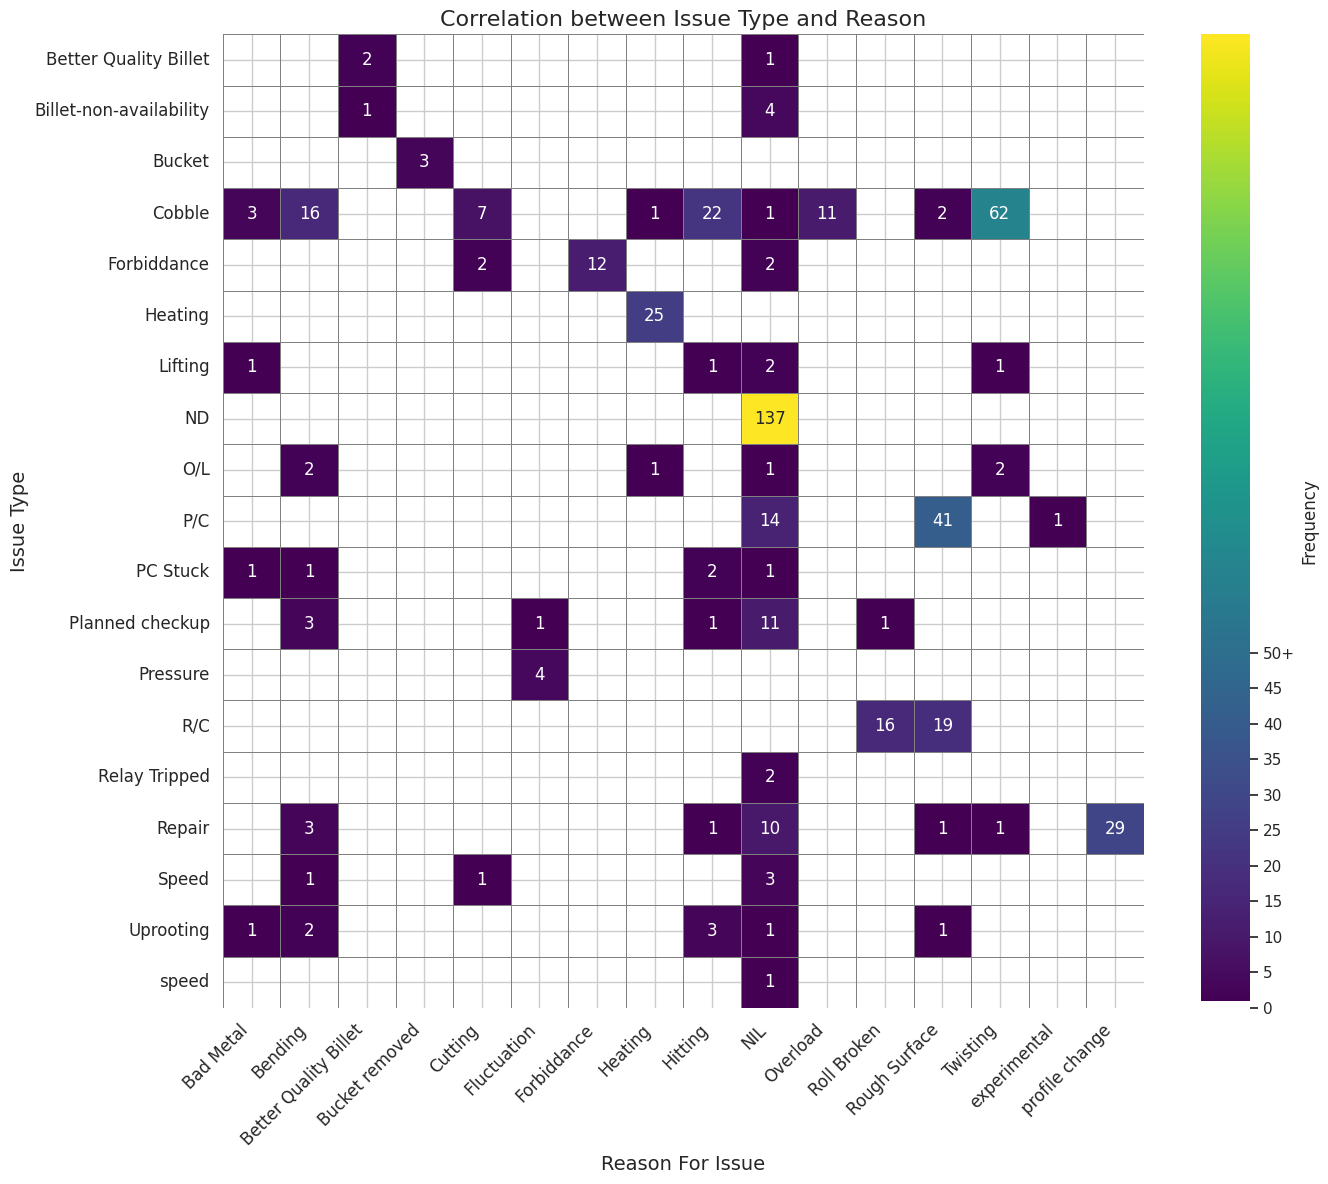
A deeper examination of the reasons behind these issues, with the identified problems, will provide clearer insights into the root causes driving these occurrences.
The heatmap shows that cobble, which is a big problem when making things, is usually caused by twisting. This is the main reason. This is followed by instances of hitting, bending, and overload, each contributing to the occurrence of cobble to a lesser extent. The prominence of twisting as a cause indicates that addressing issues related to the torsional stability of materials or products during manufacturing might be an effective strategy to reduce cobble rates. It may also be beneficial to examine the machinery and processes where hitting, bending, and overload occur, as these are additional factors contributing to the problem. Implementing preventative measures or controls in these areas could lead to a decrease in cobble occurrences and overall production improvements.
The heatmap and previous analysis indicate that P/C (Phase Change) and R/C (Roll Change) are significant issues associated with rough surfaces, indicating a potential link to machinery wear and tear. Particularly at the end stands stand-9, stand-10, and stand-12 (except stand-11, which is not utilized for Channel 75 production) The frequency of roll breakages contributing to R/C issues further reinforces the notion that these stands endure a higher degree of stress or deterioration.
Considering these stands are positioned later in the production line, it's plausible they are subject to cumulative effects of the manufacturing process, leading to more frequent maintenance needs or component failures. This information could guide a targeted maintenance schedule or a review of operational practices at these specific stands to mitigate wear and reduce the incidence of related issues.
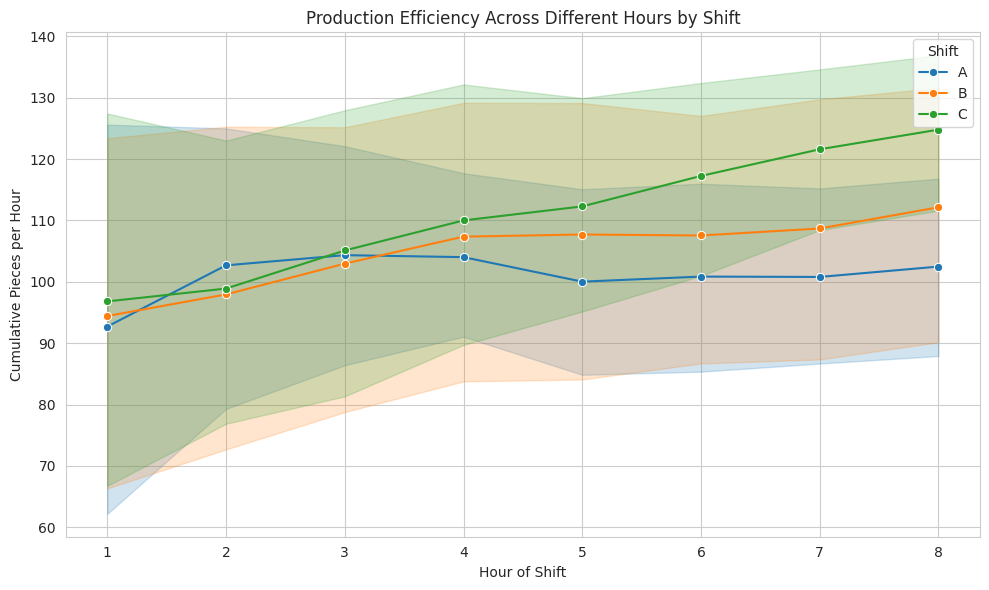
Another critical factor to examine is the variance in production efficiency across the various work shifts.
The data reveals that Shift C leads in average production efficiency, with approximately 110.85 items manufactured per hour. Shift B follows with an average of 104.85 items per hour, while Shift A has the lowest average at 100.99 items per hour. This discrepancy in productivity may be attributed to the increased availability of resources typically allocated to the day and swing shifts, namely Shifts A and B.
Additionally, a noteworthy trend is observed at the transition between shifts: the onset of a new shift does not match the productivity levels seen in the final hour of the previous shift. This could imply that any pending issues from the previous shift are being addressed at the start of the new one, which may temporarily lower production rates until the process stabilizes and returns to full capacity.
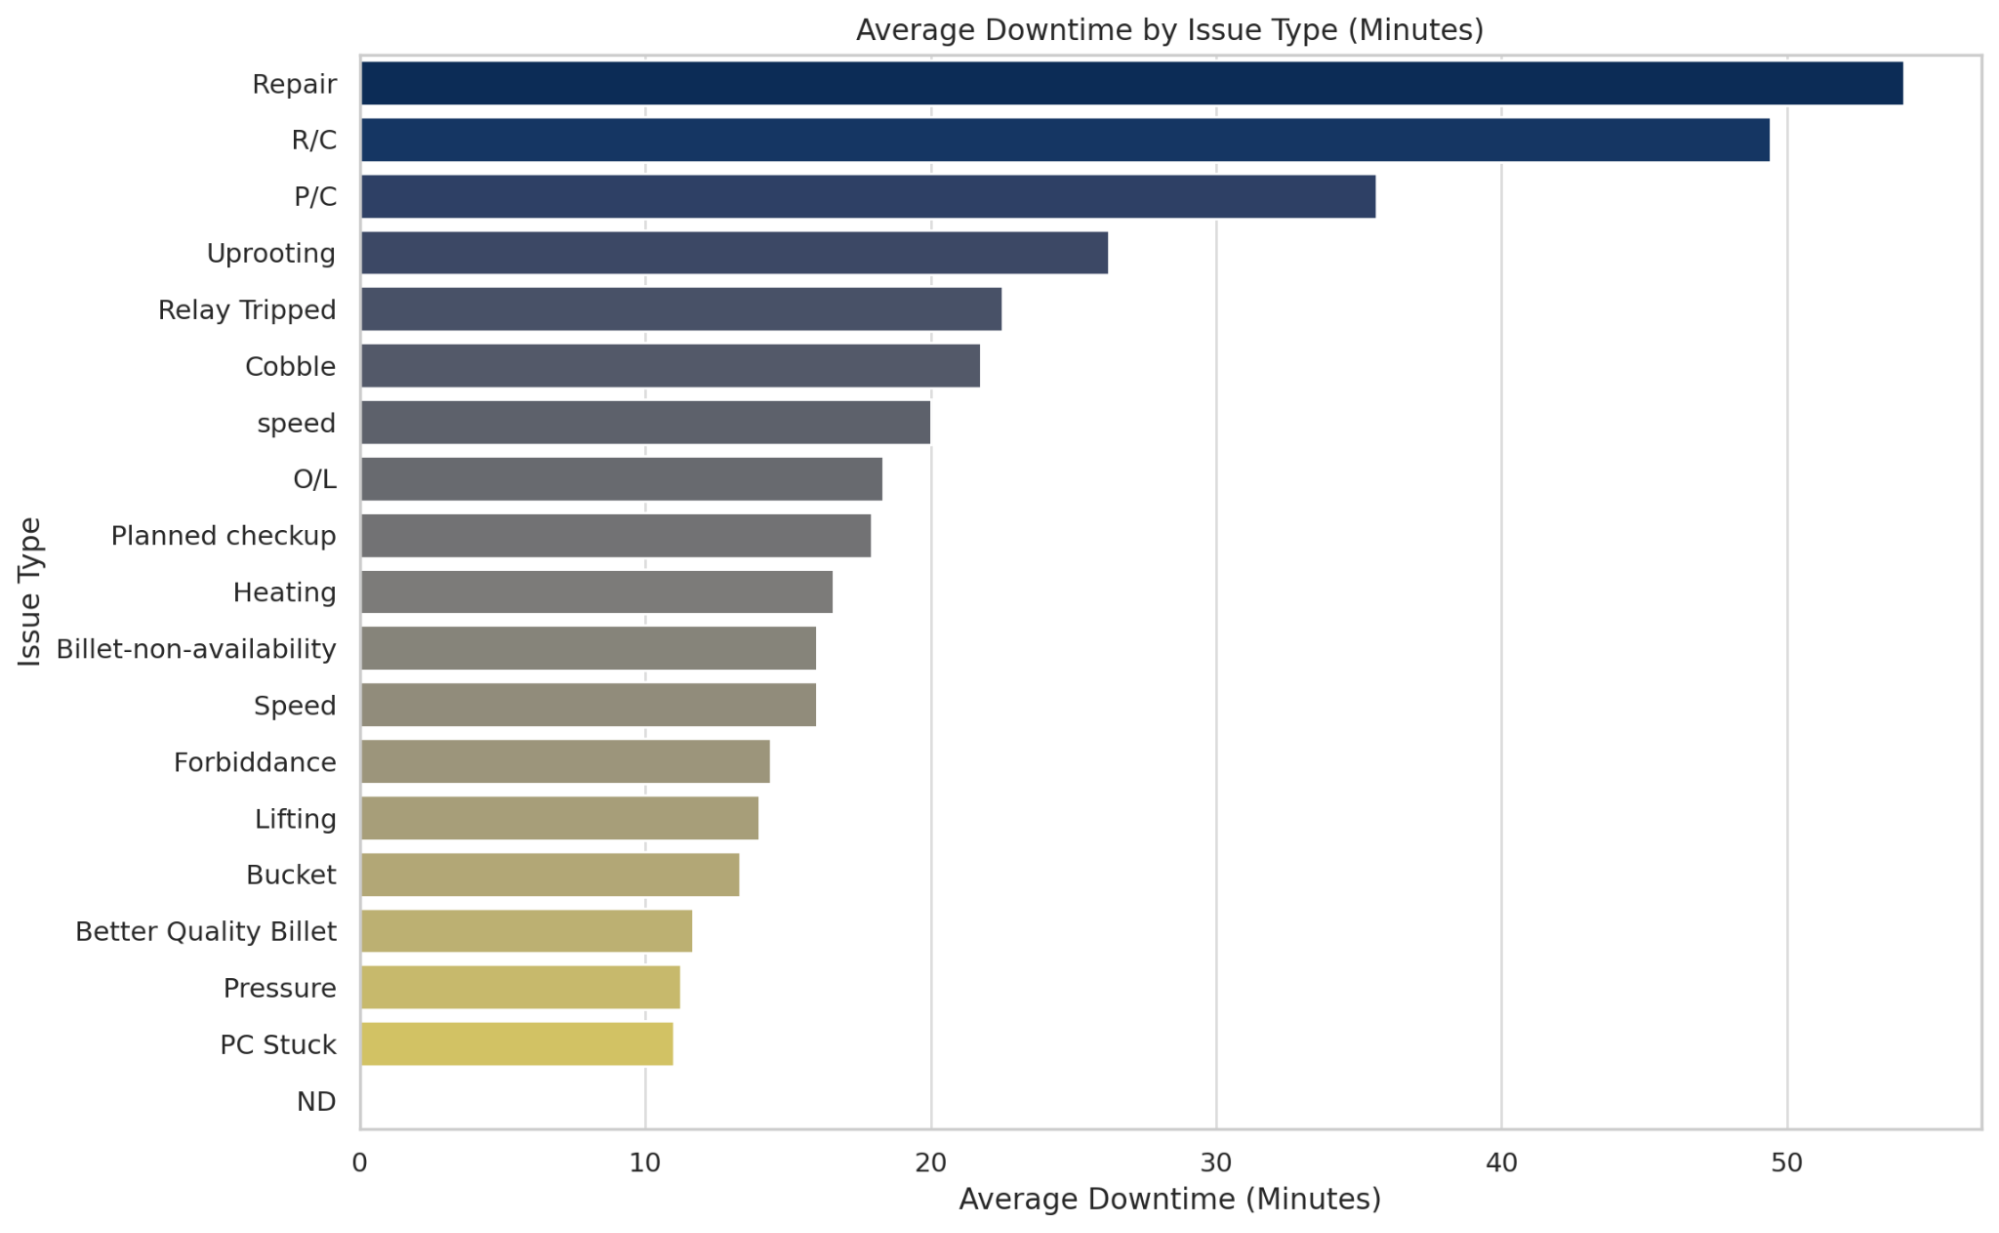
We can further try to understand what issues cause the most downtime. One thing to note is that since we are delaying with hourwise data, the Maximum possible delay is 60 mins or an hour.
Average delays are approximately 22 minutes. Repair leads to the longest average downtime, which suggests that when product line changes, they result in significant production delays.
R/C (Roll Change) and P/C (Phase Change) also show notable average downtimes, indicating that these routine changes are substantial factors in operational halts.
Uprooting and Relay Tripped are less frequent issues but cause considerable average downtimes when they occur.
The issues like Cobble, Speed, O/L, and Planned Checkup show moderate average downtimes, which could represent a mix of routine and unexpected interruptions.
Issues such as Billet Non-Availability, Forbiddance, and Lifting are on the lower end of the downtime impact scale but are still notable contributors to production delays.
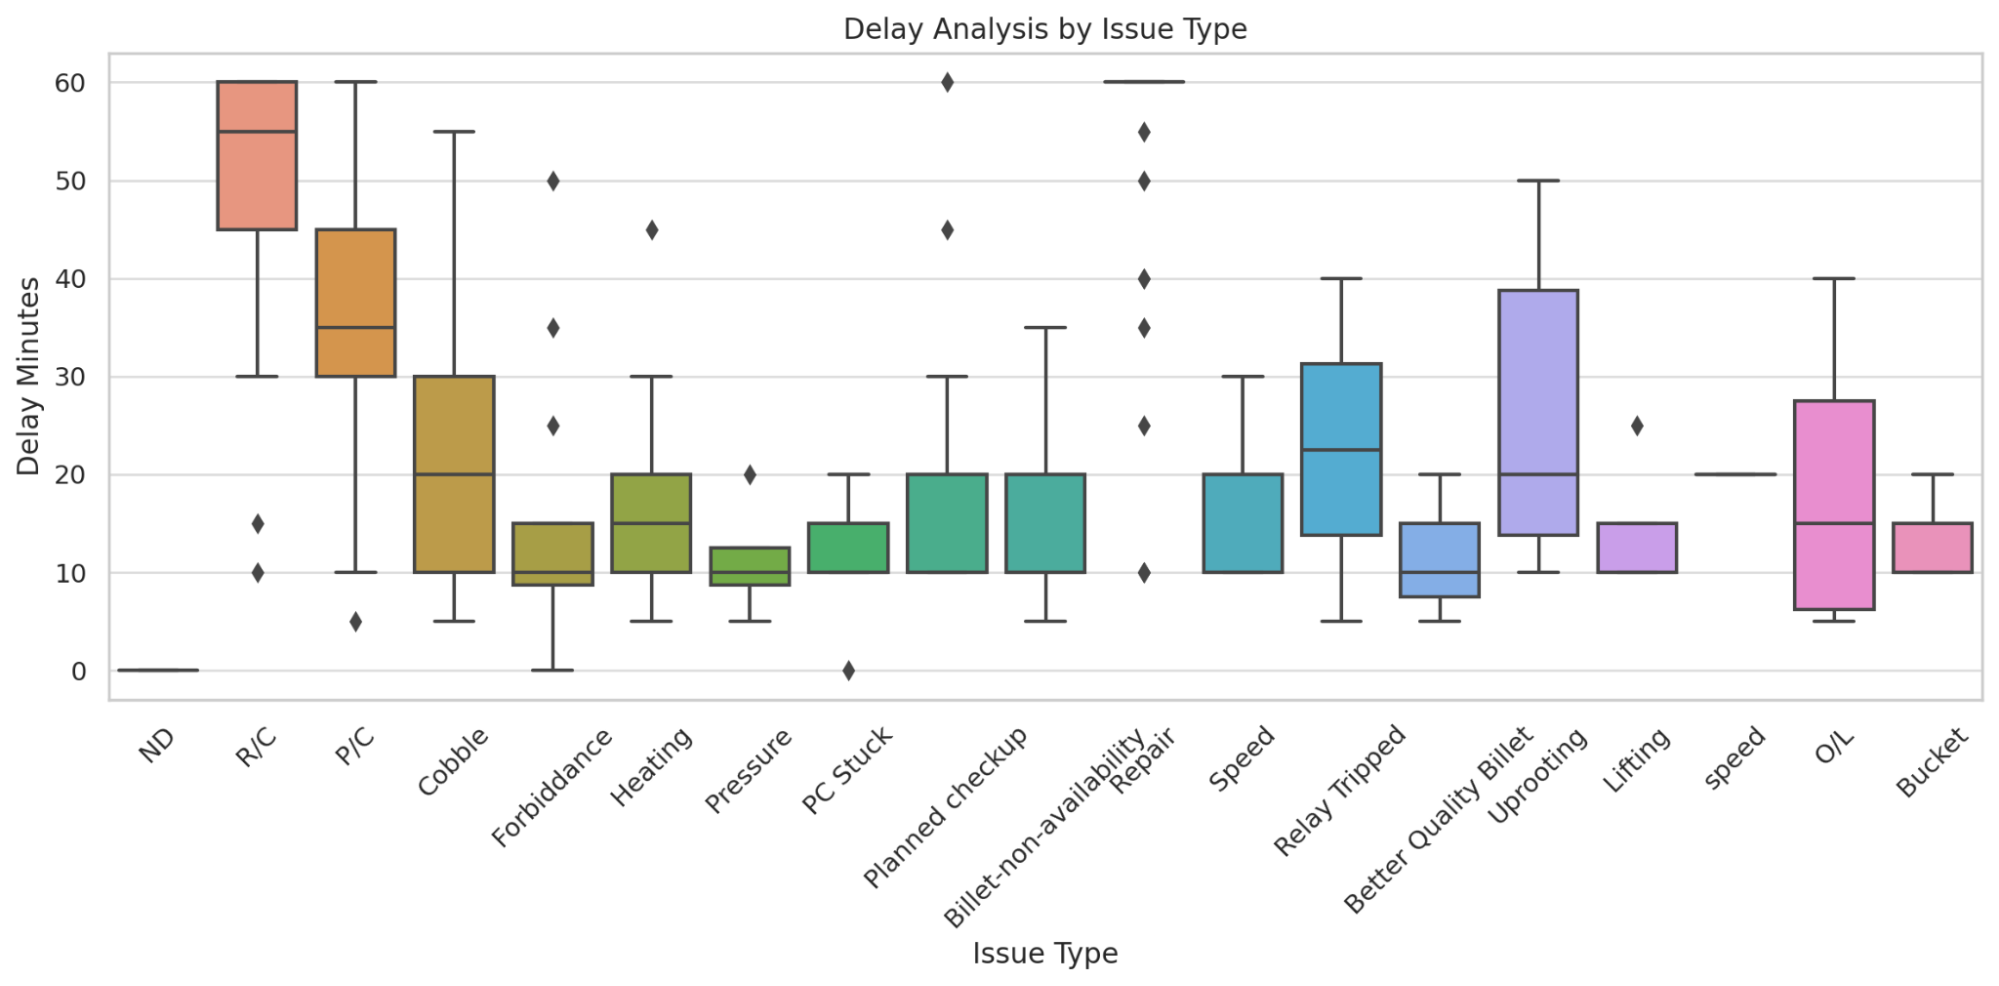
There's a wide distribution in the downtimes associated with R/C, as indicated by the extended interquartile ranges and outliers, suggesting high variability in how much this issue can affect production.
Cobble shows a tight interquartile range but with many outliers, implying that while most cobble-related downtimes are predictable, some instances can cause significant delays.
The variability in downtime for Heating and Billet Non-Availability is relatively low, indicating consistent durations for these issues.
The issues at the lower end, such as Speed, Better Quality Billet, and Bucket, show small interquartile ranges with few outliers, suggesting these issues have a consistent and predictable impact on downtime.
Despite the Merchant Mill being an older facility, the successful application of AI, data analytics and visualization demonstrates significant potential for improvements. This approach can be extrapolated to other production units, enhancing older plants and optimizing the entire manufacturing ecosystem. Our interpretation of the results can be summarized as follows.-
Mechanical logbooks and logsheets have been meticulously recorded by the mill staff at Bhilai Steel Plant's Merchant Mill, allowing for the retrieval of historical data. However, there are substantial opportunities to enhance these practices through digital transformation and advanced analytics, propelling the mill towards Industry 4.0 standards.
It is imperative that a digital system be introduced to replace traditional logbooks and log sheets. The centralized database will support advanced querying and real-time access capabilities for structured storage and easy retrieval of digitized data. This will facilitate more sophisticated analysis and monitoring, thereby significantly enhancing mill productivity.
The current PLC system, which only holds 10 days of data on a 20 GB disk, needs to be upgraded. I recommend periodic upgrades to modernize hardware, augment data storage capacity, and enhance data capture capabilities. This includes recording critical operational parameters such as the furnace temperature and billet grade, which influence production rates and product quality. Furthermore, one of the findings was that some billets, such as Sailma, have a better production rate than others.
There is a promising scope for implementing machine learning models to enhance operational insights. For instance, using Isolation Forests for anomaly detection in PLC data has demonstrated potential in early diagnostics. Here is an example using the data from the PLC of stand-4. I propose expanding this approach with continuous monitoring systems that automatically calculate and report hourly performance metrics—such as average load, peak load, and minimum load—providing mill personnel with actionable insights through interactive visualizations.
Maintenance schedules should be informed by data-driven insights obtained from advanced analytics and visualization tools. Customized predictive maintenance plans can be developed for each shift, leveraging historical and predicted data trends to optimize operational efficiency and prevent equipment failures. Based on the data I have, here is the current maintenance plan estimate. It is strongly recommended to update this estimate with the current experience.
It is crucial to address issues such as Cobble, P/C, R/C, and Repair with targeted interventions. I recommend setting up dedicated maintenance teams for hotspot locations, equipped with the necessary tools and training to tackle these challenges effectively.
Strategies to minimize downtime should include balancing operational efficiency across shifts and creating rapid response teams that can address critical issues quickly, minimizing operational disruptions.
A computerized reporting system should be established to provide regular updates on equipment health and efficiency, augmented by a quick-reporting function within the digital recording system.
It's important to keep an eye on important results and check if changes are working. This helps make sure everything stays better. For PLC data, I suggest checking in the views of 10 minutes, hourly, and daily data every hour.
I extend my heartfelt thanks to Shri SK Hariranimni Sir, GM and HOD of Merchant Mill, and RaviKant Sir, GM of SMS-II, for their invaluable guidance. I am grateful for the facilitation and support provided by HRD, and for the insights from Hariranimni Sir and Ravikant Sir, which greatly enhanced my understanding and execution of this project.